
To not miss out on any new articles, consider subscribing.
Introduction
Have you ever thought that something was so true and realized later that it wasn’t true? I’m sure that many of us can relate to this. When there is an assumption or belief that making a certain change(s) will lead to some expected results, instead of just running with this assumption and making the changes, testing your hypothesis is a way of investigating this belief, collecting data, and analyzing the results to know if this assumption is actually right and should be adopted or not. Hypothesis testing is the process of validating an assumption using experiments and statistical analysis.
In this article, I will walk through what a hypothesis is, what a hypothesis test is about, why we should consider doing it, some testing methods, how to evaluate results from the test accurately and interpret these results, some tips to run better hypothesis tests, and finally, what to do with the results you get from the tests.
Here are the things you can expect to learn from reading this article:
- What is a hypothesis?
- Why hypothesis testing?
- Applying this in A/B testing
- Multivariate testing
- How to analyze results from a hypothesis test
- Statistical significance and p-value
- Type I and II errors
- Statistical power
- Tips for running better hypothesis tests
- Presenting your results
- Conclusion
What is a hypothesis?
A hypothesis is an informed assumption about a system or an element in a system. It should be possible to either prove or disprove any hypothesis by testing it via an experiment. To run a hypothesis test, you need to always have a null hypothesis which denotes that the change does not lead to any results as expected. Then, the alternative hypothesis states that the change is believed to bring about expected results. All hypotheses should begin with “I believe”’ or something similar.
Why hypothesis testing?
Hypothesis testing is important in various application areas. From businesses to medical care to almost any field you can think of. For example, how are we sure that this particular feature the team wants to add to the product will increase user engagement as we think? One might be of the opinion that we could simply track the user engagement after the feature was deployed, compare it to the user engagement before that feature and draw a conclusion from that. However, what if the change in user engagement (if any) is because of something else? Let’s say, increased marketing or seasonality. Hypothesis testing is one way to be sure if a change led to the desired outcome and should be sustained or not.
Applying it to the example above, this could be the hypothesis test:
- H0 (null hypothesis): The feature causes no change or negative change in the user engagement.
- H1 (alternative hypothesis): The new feature will lead to increased user engagement.
These hypotheses could then be tested by deploying an A/B test with the new feature and measuring the engagement of the users in this test.
Then, the results from the test can be analyzed using any method of choice. If the results meet the expected outcomes, then we reject the null hypothesis and accept the alternative hypothesis. This means that the new feature led to increased user engagement, hence, it should be implemented fully.
Running a hypothesis test, based on the data we got, increased our confidence in the actual impact of the new feature if there was any impact at all.
What is A/B testing?
I mentioned this phrase in the previous section and you might be wondering, what is an A/B test?
A/B testing is a technique of comparing two versions of a variable by comparing performance among two distinct groups, let’s call them variant A and variant B. It is sometimes referred to as split testing. Business-wise, an A/B test is where two or more variants of a web page are shown randomly to different groups of users, and performance by each group of the desired metric is evaluated after a specific time period to see which variant performed better for the business goal.
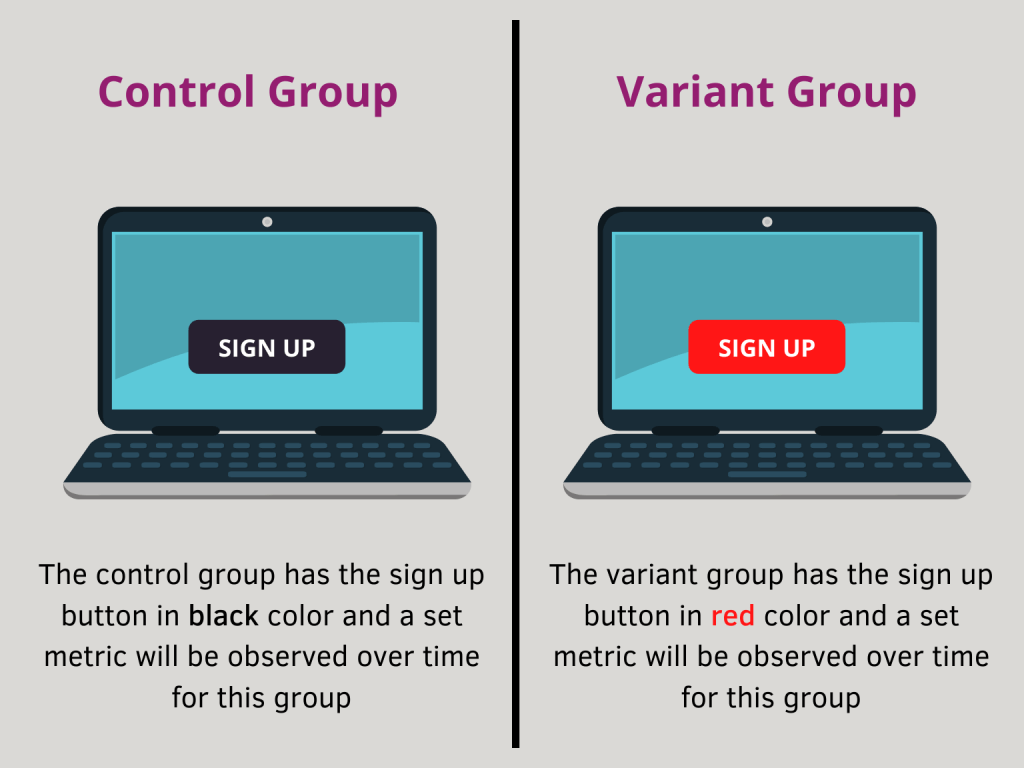
The simplest form of A/B testing is where there are just two groups: a control group and one variant group. The control group sees the original version with nothing changed, while the variant group sees the version where a feature or the entire page is changed based on a hypothesis that this change will produce desired results.
Let’s take an example where the hypothesis is that ‘changing the signup button to red’ will increase signups. In this case, the control group will see the original button, while the variant group will see a red button, and then at the end of the test, the conversion (in this case, signups) of both groups will be measured to accept or disprove the hypothesis.
Multivariate testing
Another test that is similar to an A/B test is a multivariate test. This is when more than one variable is being compared. Hence, there are multiple variants and the aim of this is to measure how these variables interact/relate with one another to result in expected performance.
Using the example above, multivariate testing would be changing the signup button to red color and the text color to white increases conversions. The control group will not see any change, while variant one will see a red button with the original text color, variant two will see the original button with white text color and variant three will see a red button with text in white. After this, the results from these variants will be evaluated to see how these variables impact the desired conversions. Notably, running a multivariate test needs a larger sized audience or site traffic to get meaningful results because the samples are divided into more groups than an A/B test. Some tools you can use to run multivariate or A/B tests on the web are Optimizely and Google Optimize.
How to analyze results from a hypothesis test
Before we go into analyzing results from a hypothesis test, there are certain values that must be set to make the test and results valid. These are statistical significance and p-value. In the next section, I will go over these values, what they connote and why they are important.
Statistical significance
When running a hypothesis test, you need to be sure that the data you are collecting from the experiment is due to the changes you made and not a random occurrence. This is what statistical significance seeks to measure.
The statistical significance is the measure of how certain you are that the results from the hypothesis test are due to the change applied, not by random chance, hence, the experiment can be replicated to get the same results.
It is usually represented as a percentage, typically set at 95% or 0.95. This means that we are 95% confident that the results are not a random occurrence and can be replicated. Statistical significance can also be referred to as confidence level.
p-value
This is the opposite of statistical significance. The p-value is a measure of the probability of the results of a hypothesis or statistical test being an outcome of a random occurrence and not due to the variable being tested. A p-value is a number, calculated from a statistical test, that describes how likely you are to have found a particular set of observations if the null hypothesis were true. It can be calculated as 1 – statistical significance (in decimals) or 100 – statistical significance represented as a percentage. The most common p-value is 0.05 or 5%. That is, we are 5% certain that the results of the test could be due to random occurrences and not a reflection of the proposed test.
The desired method used to analyze results from a hypothesis test is dependent on many factors like sample size, the metric being measured, and the desired results to be observed from the test. Some of the methods that can be used to analyze hypothesis test results include basic calculations like differences in sample means or sample proportions or counts, more complex statistical tests like Analysis of Variance (ANOVA), chi-square, regression, etc.
After analyzing the data, you either accept or reject the null hypothesis. Rejecting the null hypothesis means whatever variable you were testing with expected results was valid while accepting the null hypothesis means the variable changed does not affect the metric being measured, hence, the expected outcome is incorrect.
However, what if I accept the null hypothesis, in error, when I should have rejected it and vice versa? What does that mean for your test? This will be discussed in the next section.
Type I and Type II errors
After running a hypothesis test and analyzing the result, there are two common errors that could occur. The first one is when the tested variable did not influence a change, but we falsely accepted the alternative hypothesis and stated that the variable led to a change. This is known as a Type I error and it produces a False positive.
The opposite of that is a Type II error. This error produces a False negative. This is when the assumption actually led to the expected outcome but we erroneously accepted the null hypothesis indicating that the change did not lead to the expected results.
Type I error means claiming something has happened when it hasn’t, while Type II error means that you claim nothing is happening when in fact something is, and a higher level of statistical significance means we have more guarantee against committing a Type I error.
Statistical power
What is statistical power? Statistical power is the probability of not committing a Type II error. It is the likelihood that a hypothesis test correctly rejects a null hypothesis and produces a true positive.
The statistical power is relevant in determining the minimum sample size needed to be able to observe the expected effect, from a hypothesis experiment, given the set level of significance. It is obtained by running a power analysis and this is usually done before the data collection process for the hypothesis test.
Tips for running better hypothesis tests
One of the major factors to consider when running hypothesis tests to get better results is the sample selection and duration of the test. The sample size should not be too little, as unbiased as possible, and a good representation of the entire population. A statistical power analysis is a good way to determine the right sample size. For the control group, that is the group that the proposed change was not applied to, it should be a randomized selection and there should be a clear mechanism of obtaining the data to evaluate the results afterward.
The duration of the hypothesis test is dependent on the business needs, goals and metrics needed. However, the test should be allowed to run until the sample size is sufficient or large enough to analyze the results without bias. When setting the goals, it should be detailed and focused. Don’t try to test many factors in one hypothesis test. It should be specific and preferably, short-term.
Presenting your results
The final task in hypothesis testing is presenting your results and findings. You want to be able to present it to different stakeholders, some of whom might not be as technical. One very vital skill in experiments and statistical tasks is tying it back to the business needs and practical business decisions. Numbers and probabilities are cool and all, but we want to be able to translate this to real-life situations and give applicable recommendations based on data from the testing and analysis.
Conclusion
I hope this article has been useful in walking you through the process of hypothesis testing. You can drop a comment if you have any questions, suggestions, or feedback for me. You can also reach out to me on Twitter, LinkedIn or send an email: contactaniekan at gmail dot com.
Thank you for reading.
Aniekan.
To not miss out on any new articles, consider subscribing.

I love the way you express your ideas in simple English. Concepts that are hard to grasp put in plain context. You don’t know how many you reach out with this and the impact it has. I love reading your articles. May you be blessed for this.
With gratitude,
Gipson.
LikeLike
Thank you Gipson for these kind words. I’m really glad that the articles have been helpful so far.
Thank you for reading.
LikeLike