

To not miss out on any new articles, consider subscribing.
Introduction
As a business owner or a data scientist at a company, it is important to be able to answer questions about your product, service, or users from data. Collecting data is not enough, how can you actually access these data and “beat” the data to provide relevant insights. This is what business intelligence is all about.
According to CIO, Business Intelligence (BI) leverages software and services to transform data into actionable insights that inform an organization’s strategic and tactical business decisions. BI tools access and analyze data sets and present analytical findings in reports, summaries, dashboards, graphs, charts, and maps to provide users with detailed intelligence about the state of the business.
This article is an introduction piece to working with one of these BI tools, Metabase, to draw desired insights and use visualizations to present these findings.
Here is an outline of what the article will cover:
- What is Metabase?
- Why Metabase?
- What data sources can you connect to Metabase?
- How to setup Metabase
- Connecting Google Analytics data to Metabase
- What can you do with Metabase?
- Building dashboards in Metabase
- Limitations
- Conclusion
- Further reading
What is Metabase?
Metabase is an Open-Source analytics and business intelligence tool that enables organizations to ask questions and draw insights from their different data sources. These questions, which come as queries can be made via a user interface (not writing code) or writing native queries via the query editor. You can also create dashboards that contain multiple questions and tell a story together. It is an easy way to ask questions, draw insights from data, whether you have a high technical knowledge or not, and communicate these findings to stakeholders.
Why Metabase?
Metabase is an all-in-one platform with many features that will solve your business intelligence and analytics needs. Some of the features include:
- Ability to browse your database, see data summary and model schema, etc.
- Data syncing: Metabase automatically refreshes from the data source hourly. However, if you have a very large database or you want a specific refreshing time, you can manually set the sync time. You can also set dashboards to refresh at specific time intervals.
- Support for writing simple and very complex queries using the query editor.
- Low barrier to entry: For non-technical folks, there is an easy-to-use graphical interface to write simple queries.
- Apply filters on questions and summarize the data to obtain aggregate values.
- Automatically choose the visual type based on the query and data type. Multiple options are available and you can always change it to what conveys your results better.
- Data export in CSV, XLSX file formats etc.
- Ability to save frequently used queries and call it from new queries like a view.
- Create dashboards with multiple queries, format dashboards with text boxes as headers to show different sections, and apply filters to dashboards.
- Create segments and custom metrics.
- Receive periodic alerts via email or Slack for dashboards or queries via Dashboard subscriptions. You specify the time period you want for these alerts.
- Ability to share dashboard or queries by link. For this, your Metabase must be hosted on a server and recipients must have Metabase accounts.
- Set constraints and permissions on different tables for different users to protect data.
What data sources can you connect to Metabase?
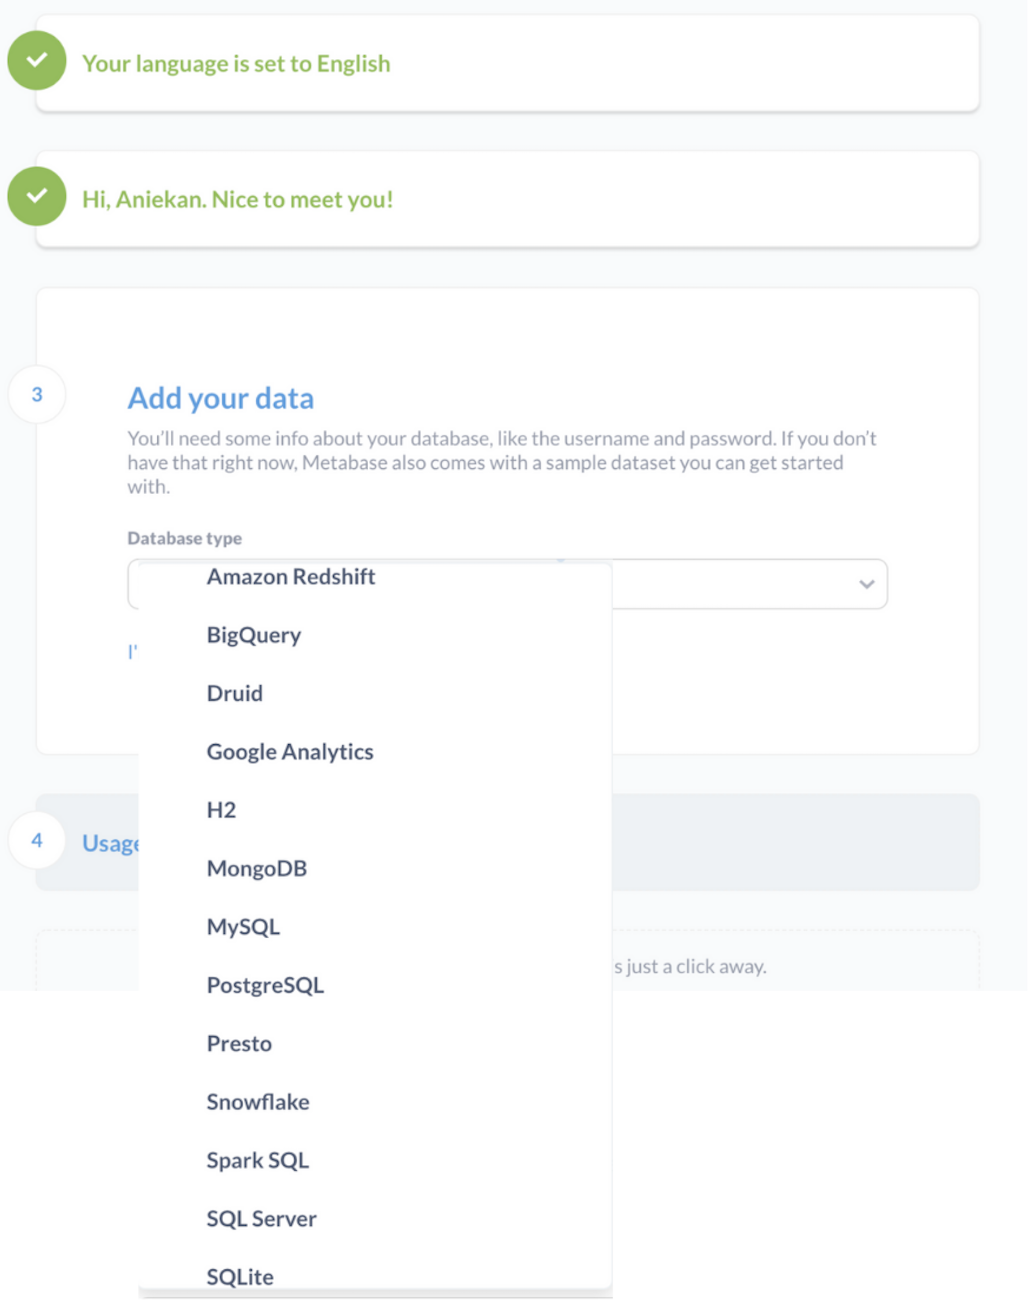
Metabase, as a querying tool, works with different kinds of databases. For clarity, Metabase only connects to already existing databases so you have to set the data sources up first before trying to link to Metabase. Some of the data sources you can connect to Metabase include:
– Amazon Redshift
– BigQuery
– Druid
– H2
– MongoDB (version 3.6 or higher)
– MySQL (version 5.7 or higher)
– MariaDB (version 10.2 or higher)
– Oracle
– PostgreSQL
– Presto
– Snowflake
– SparkSQL
– SQL Server
– SQLite
– Vertica and
– Google Analytics (version 3. GA4 is not supported yet but there is an open issue for that).
Currently, Metabase does not support data sources like Google Sheets, and custom APIs; also it is not possible to consolidate multiple data sources into one data source on Metabase.
To access data from these data sources that are not supported as databases on Metabase or to merge data from multiple data sources, you can use a connector to feed the data into a data warehouse, and then connect this data warehouse as a data source to Metabase. Alternatively, there are some community-built drivers which you can also explore for data sources that are not officially supported by Metabase. However, these drivers can only be used if you self-host your Metabase instance and not on the Metabase Cloud-hosted option.
How to set up Metabase
Metabase offers three deployment options.
- The Metabase Cloud option where it is hosted for you for a monthly fee
- The open-source option which you either host locally or on your server.
- Metabase Enterprise version, which is custom for organizations with advanced security and scale needs.
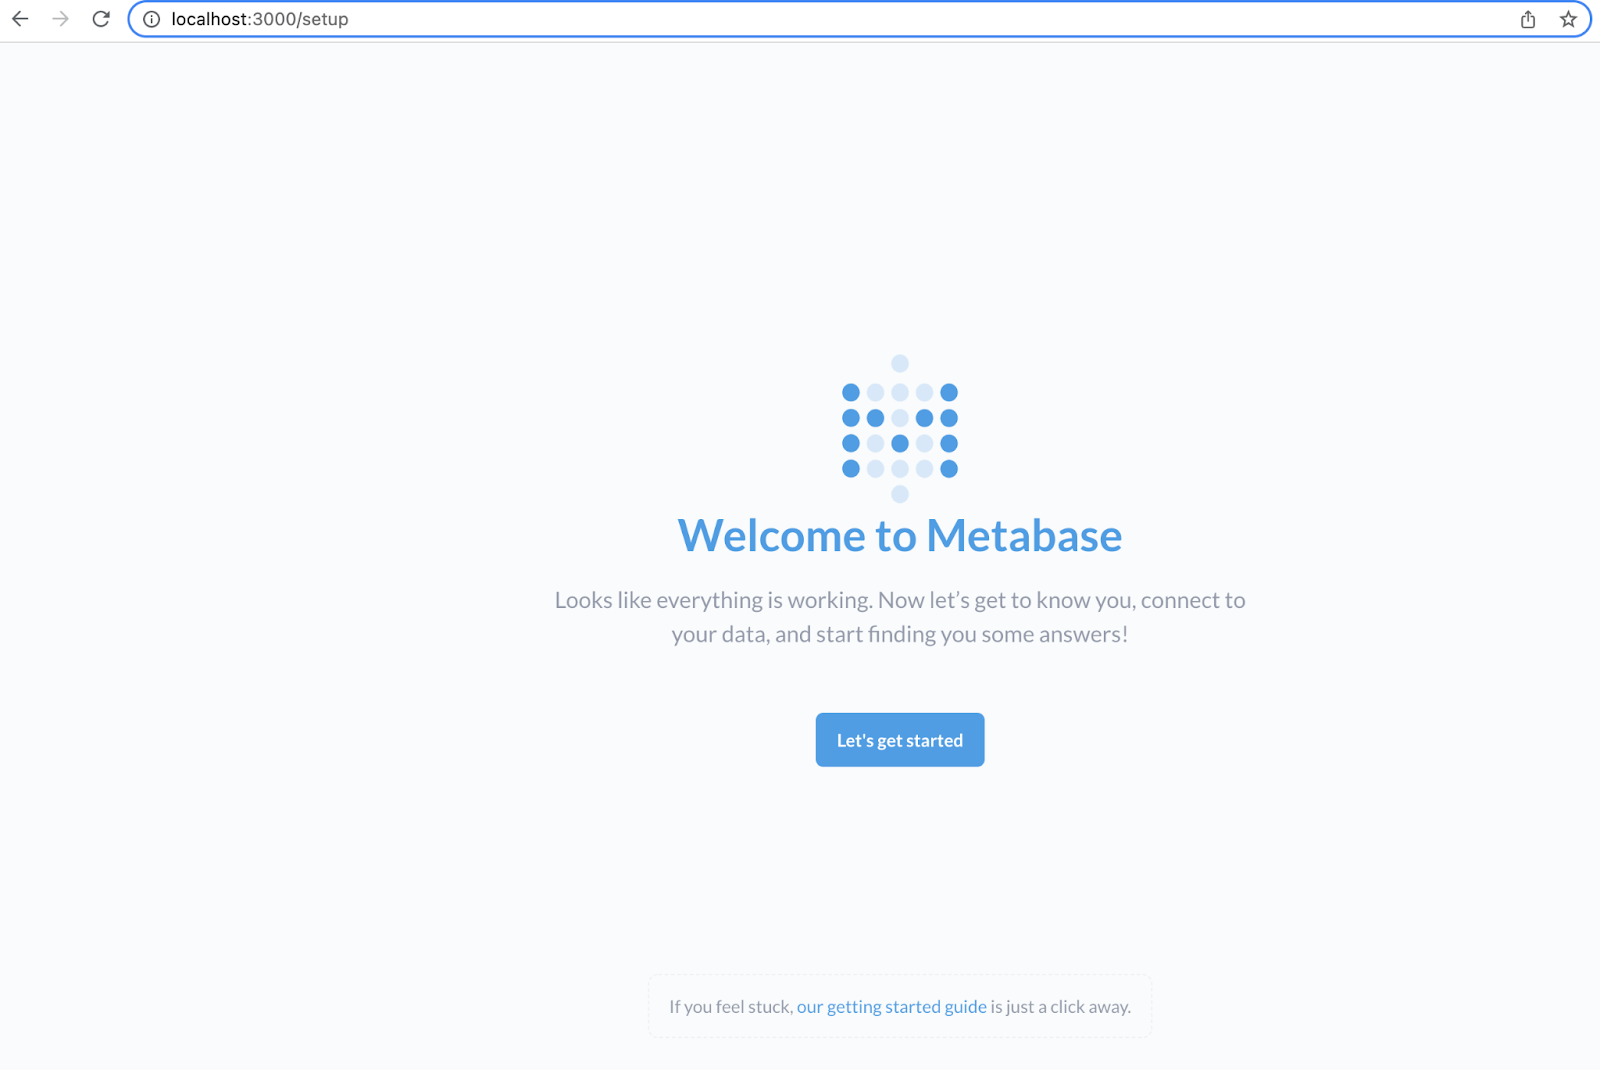
I opted for the open-source option and downloaded the prebuilt JAR file to run Metabase on my system locally. To use this option, Metabase requires Java 8 or higher to be installed on your system. You can also run it as a container on Docker. If you opt to host it locally, either as a prebuilt JAR or on Docker, you can access your Metabase by visiting `localhost:3000` from your browser.
Connecting data sources to Metabase
Once you have Metabase setup, you can go ahead to connect it to your data sources.
As mentioned above, you can connect to multiple data sources either at setup or add these data sources afterward.
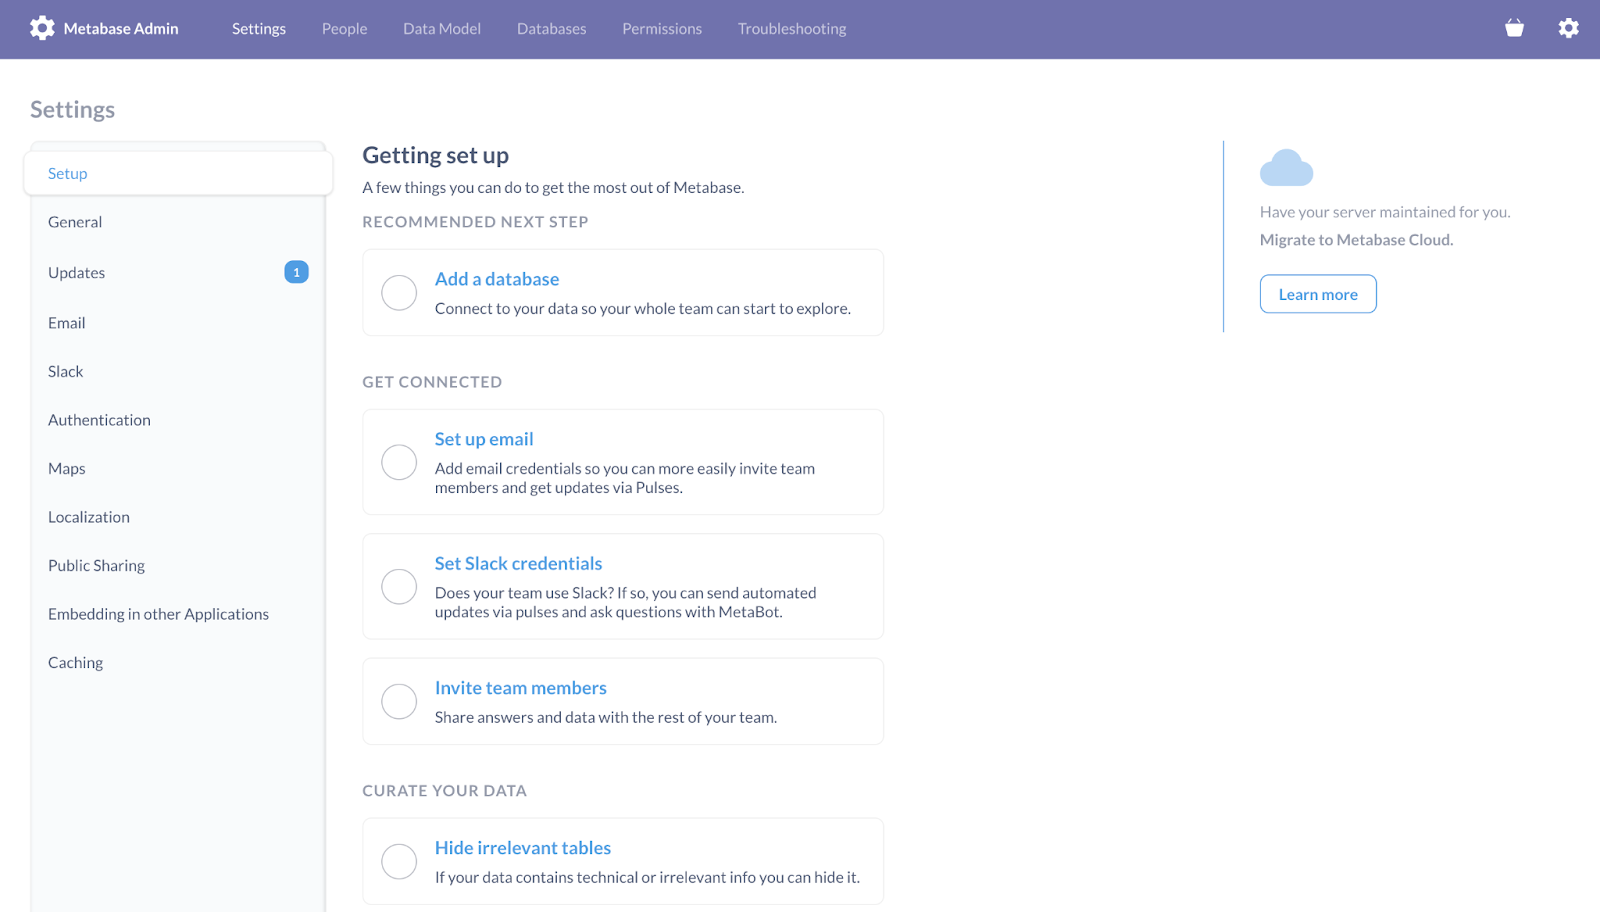
To add a data source and make other changes to your Metabase, these options are under the Admin tab.
Connecting Google Analytics data to Metabase
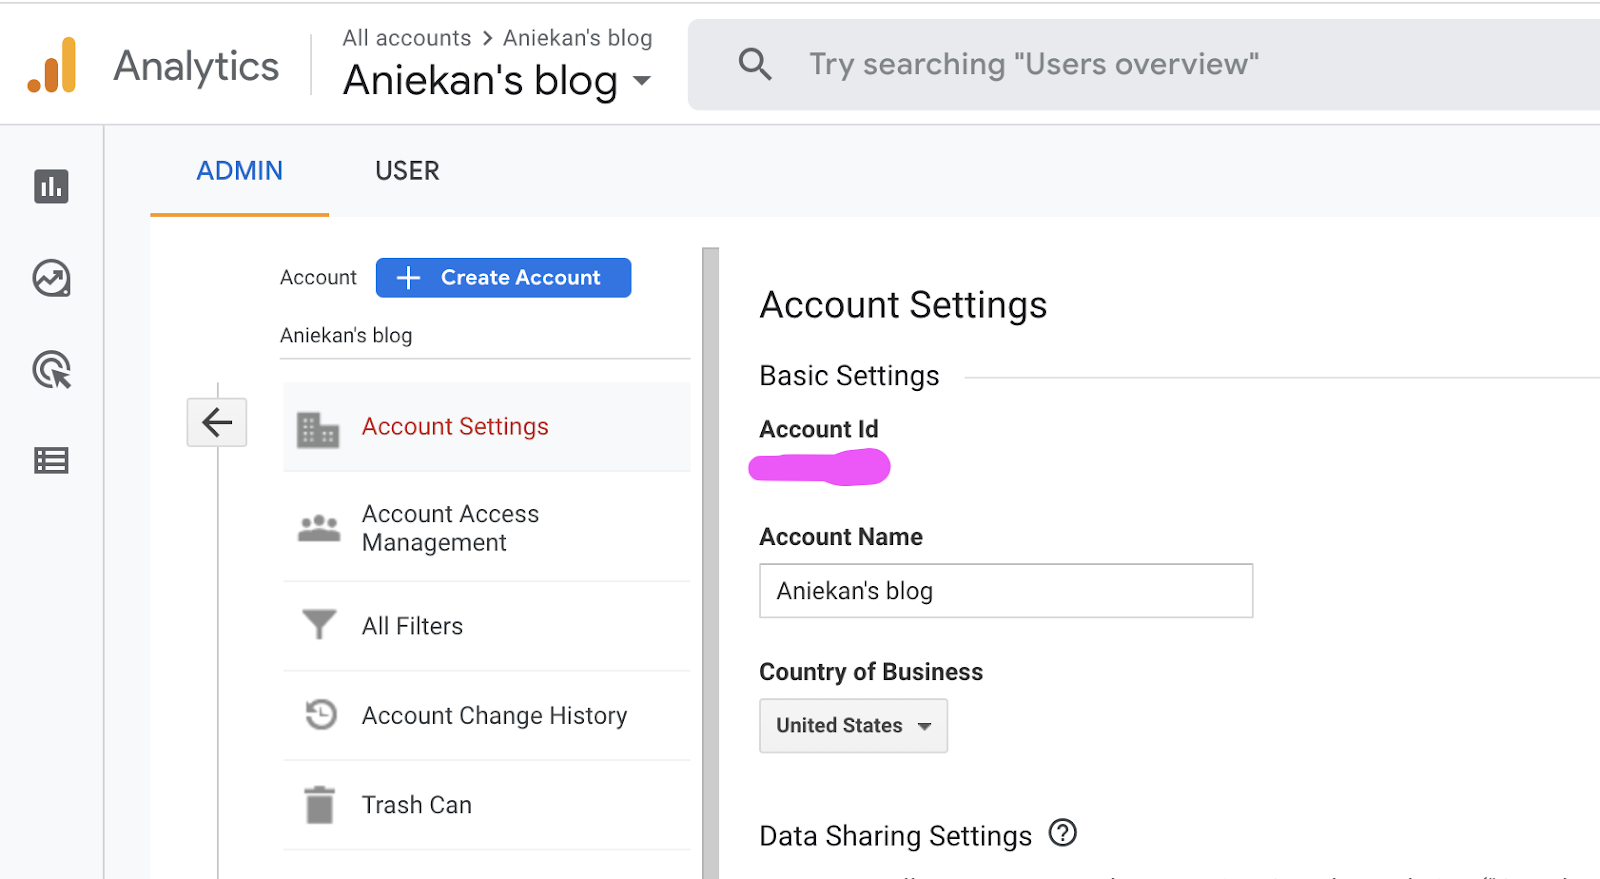
To add a Google Analytics database to Metabase, you connect your desired Google Analytics account to Metabase and authenticate the connection using your OAuth client ID on Google’s Cloud Platform. You can also set the frequency to update and sync your data here based on the size of your database your business needs.
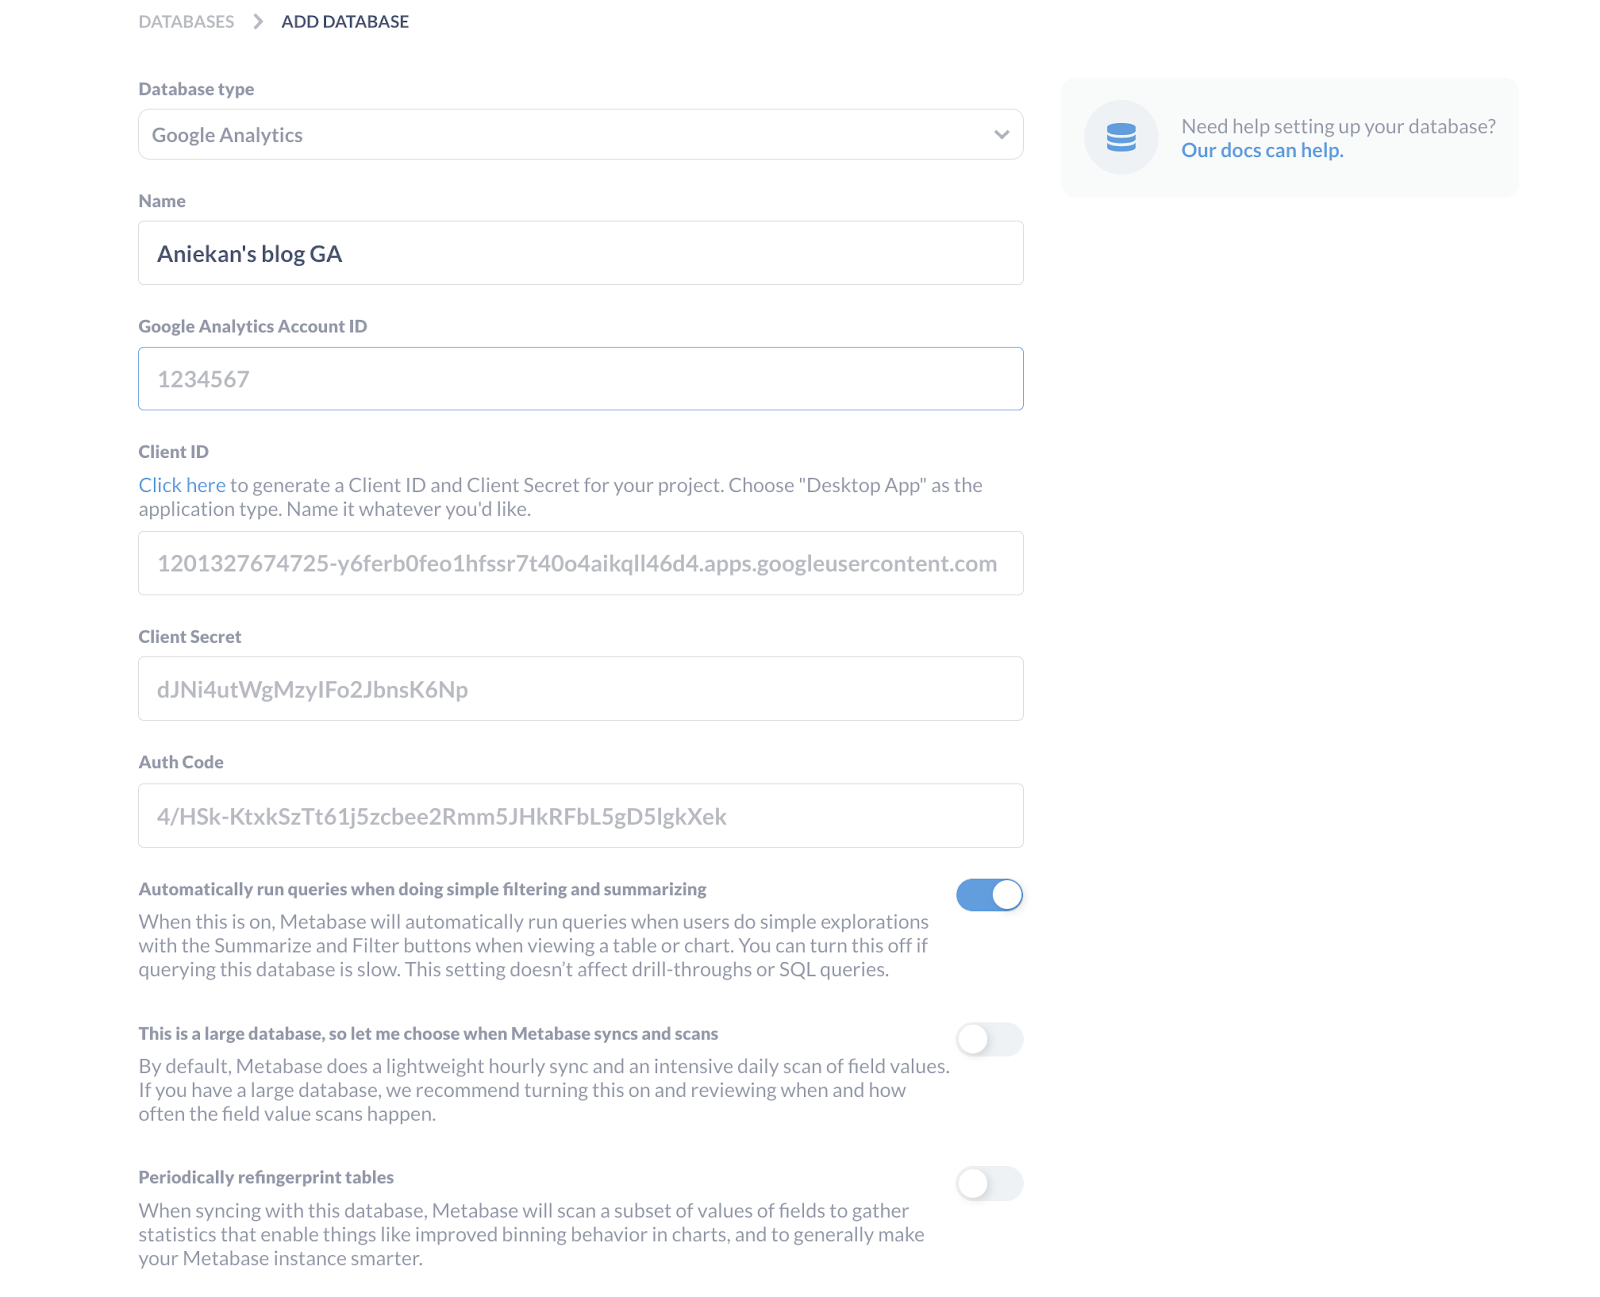
The account ID can be found in the Account settings on Google Analytics.
After adding my Google Analytics database to Metabase, I can then go ahead to explore the data.
What can you do with Metabase?
To explore the features of Metabase, I will be using a sample database that comes with Metabase to show some basic functionalities.
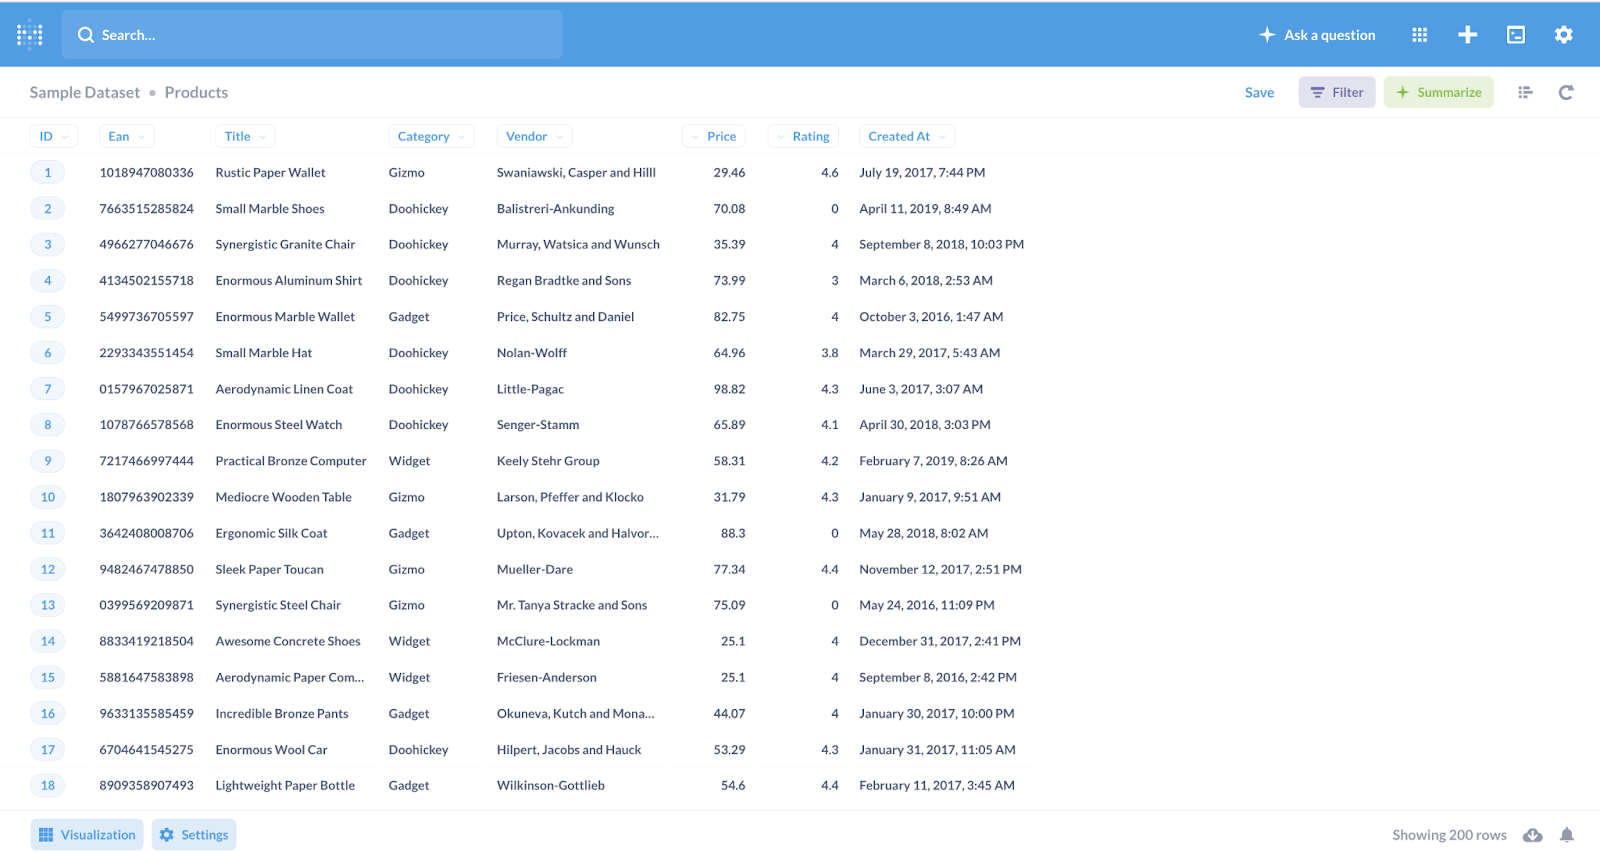
You can view the top 100 rows for each table in your database. On the bottom right, there are icons to set up alerts for changes to the table and download the entire table either as a CSV, XLSX, or JSON format.
The filter button at the top right is an easy way to query the tables based on columns while the summarize is similar to GROUPBY where the data is aggregated based on one or more conditions. This is helpful for stakeholders or analysts that do not write SQL, they can query the data and get basic insights without having to write SQL queries. But, how do we get to write SQL queries if we want to?
SQL queries in Metabase
Writing a query in Metabase is called, “Ask a question”. There are three options under asking a question on Metabase.
- Simple question: Using buttons via the UI to query a table, i.e filter and summarize.
- Custom question: Using buttons via the UI as well to query a table with additional functionalities like JOIN, and creating custom columns.
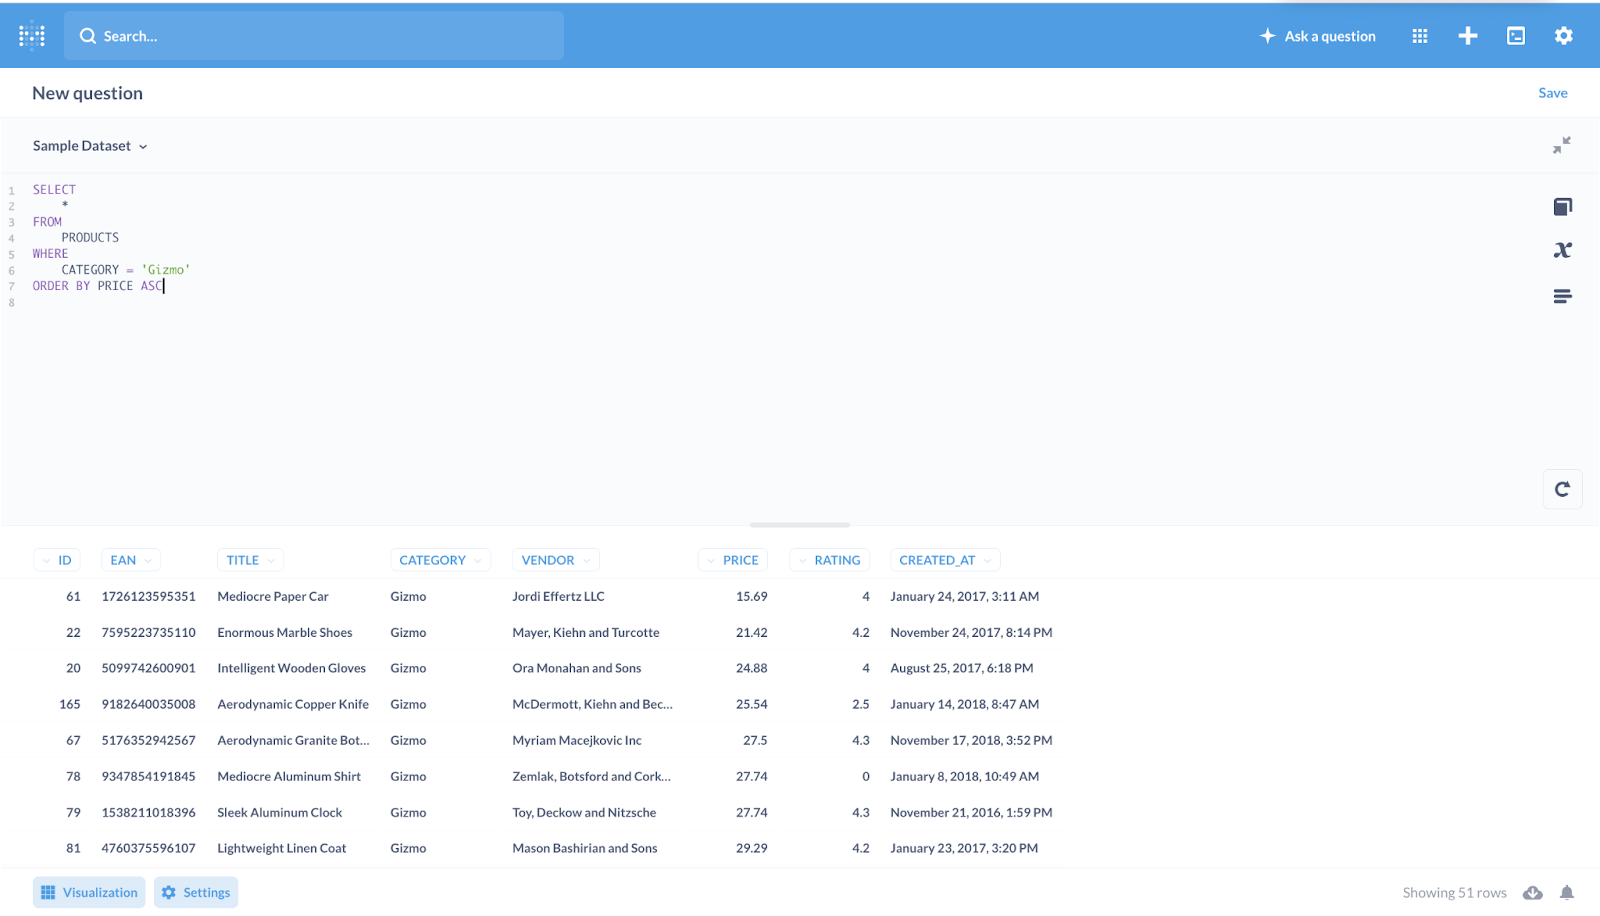
- Native query: This is where we will write the SQL code to query the data.
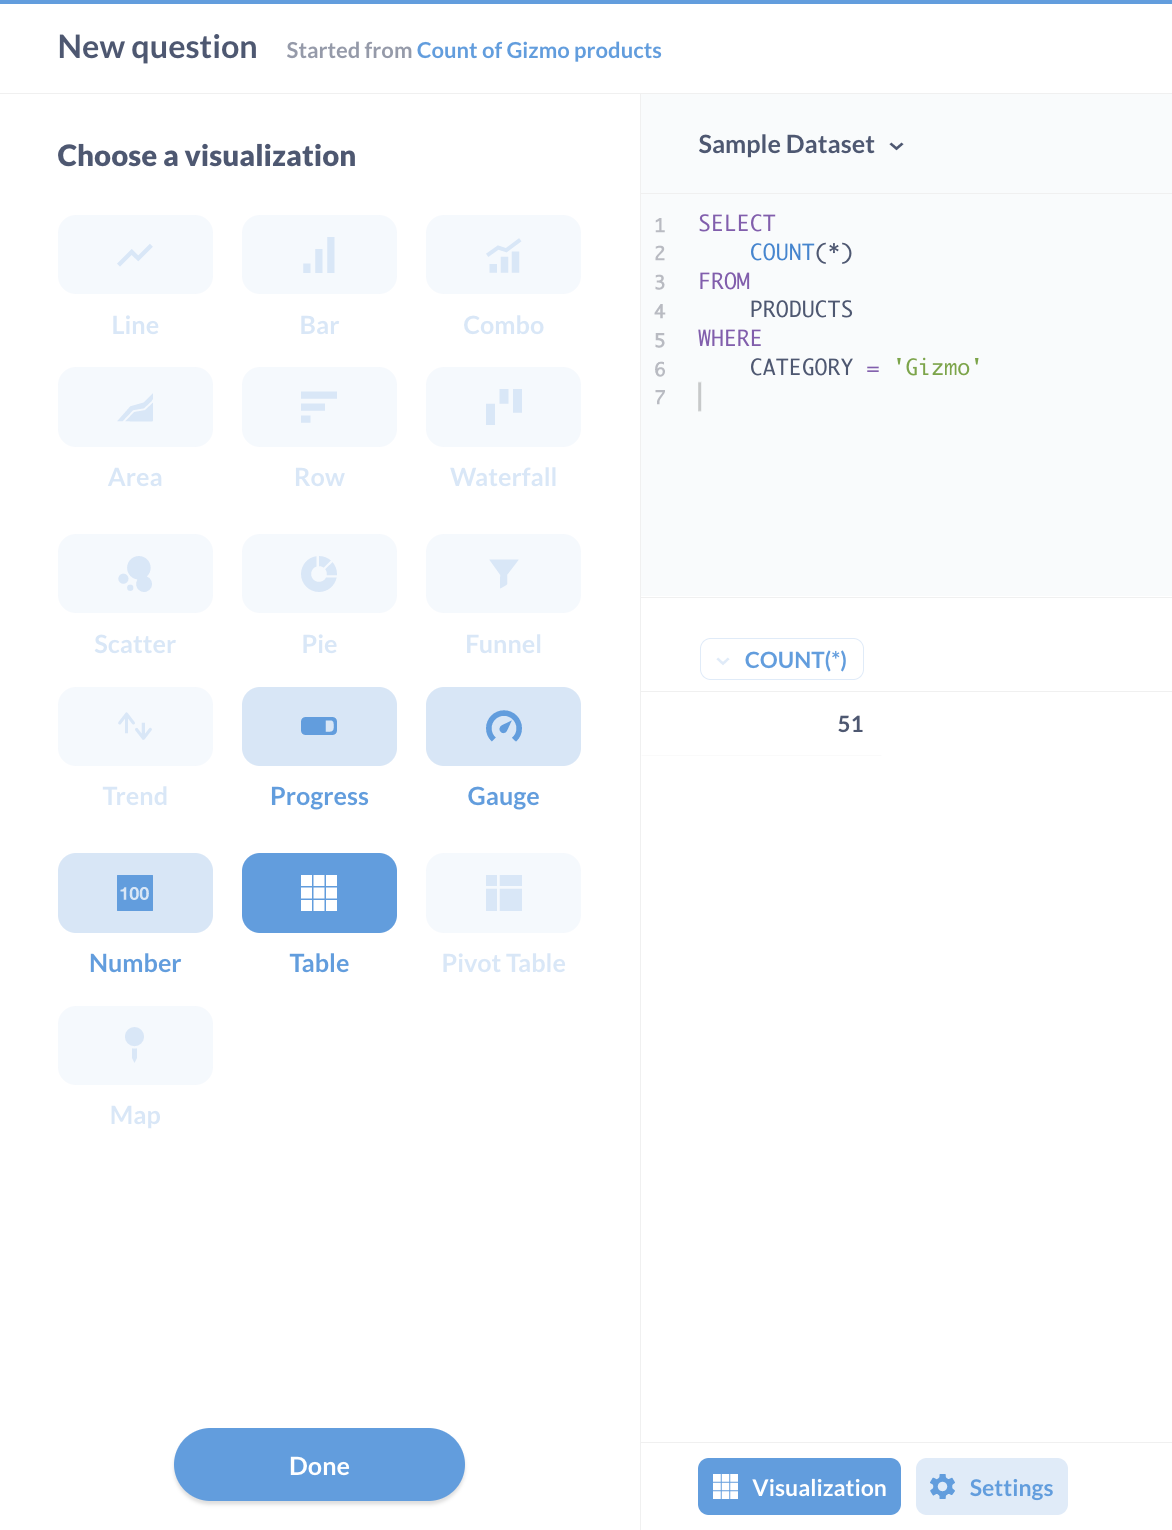
Here is a sample query written in the native SQL editor and the result displayed before. You can save this query to your collection on Metabase for future reference or add it to a dashboard. You can also download the results of your query as a CSV, XLSX, or JSON file as well. If you make any changes to a query afterward, you have to save it to update the query.
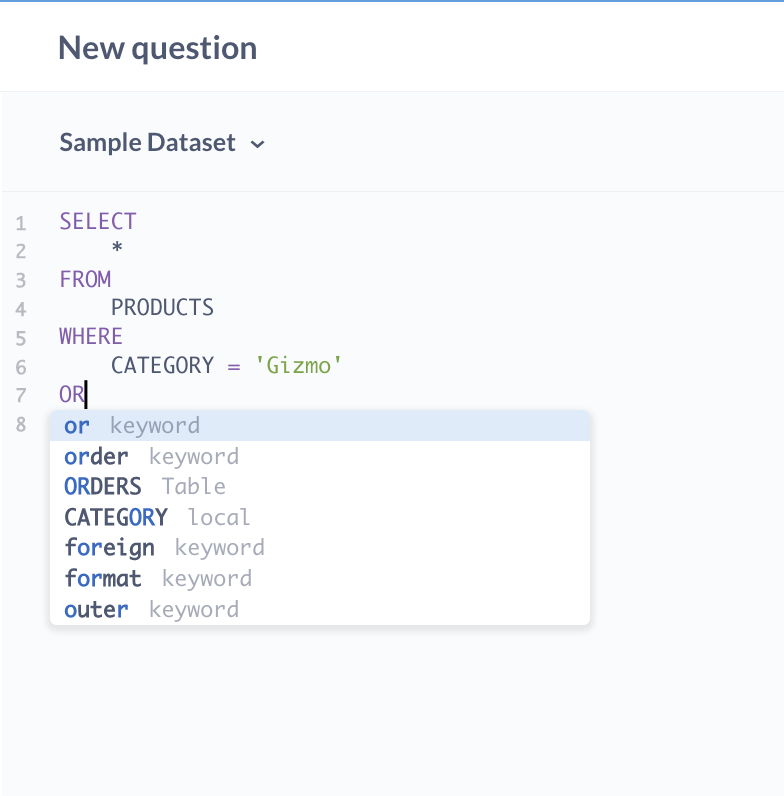
The editor also has IntelliSense which is very helpful.
Based on the nature of the result of your query, either a table, a number, a column with date and time, Metabase offers multiple visualization options that you can switch between for better representation of your data.
Building dashboards in Metabase
Dashboards are the functionality in Metabase where you can add multiple queries to tell a story. When you write a new query on Metabase and save it, Metabase prompts you to add it to a dashboard if you choose. You can either add it to an already existing dashboard or create a new dashboard and add the query to it. You can always edit dashboards as you create new queries or rearrange the query placements on the dashboard.
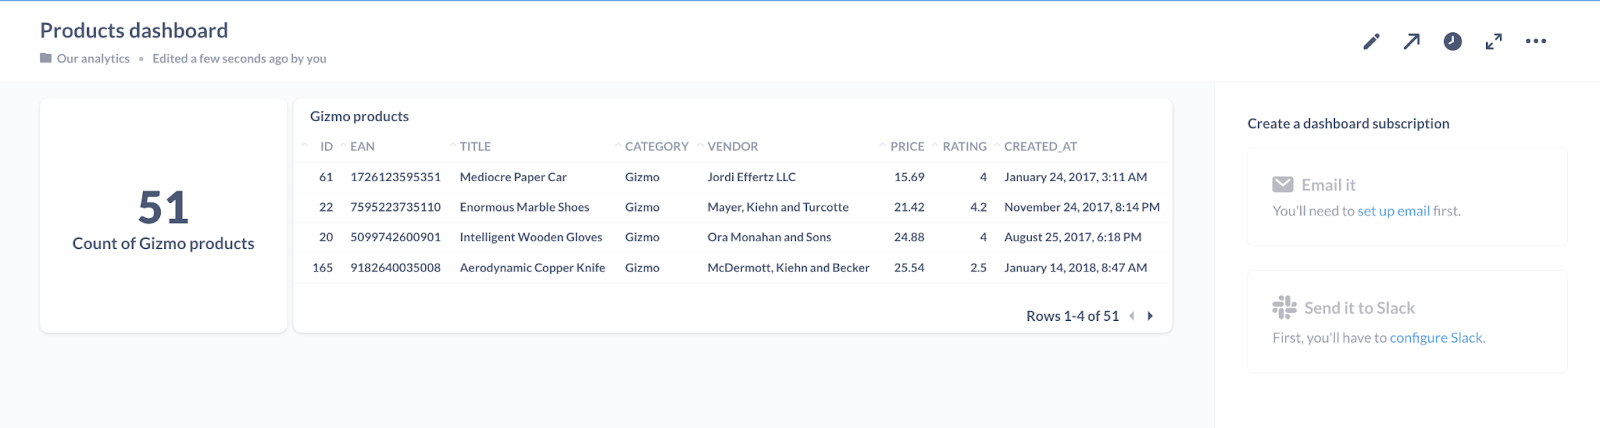
Here is a snapshot of a sample dashboard using the sample dataset, with the sharing option opened to the right, where we can set up reports to be sent automatically to selected emails or a Slack channel.
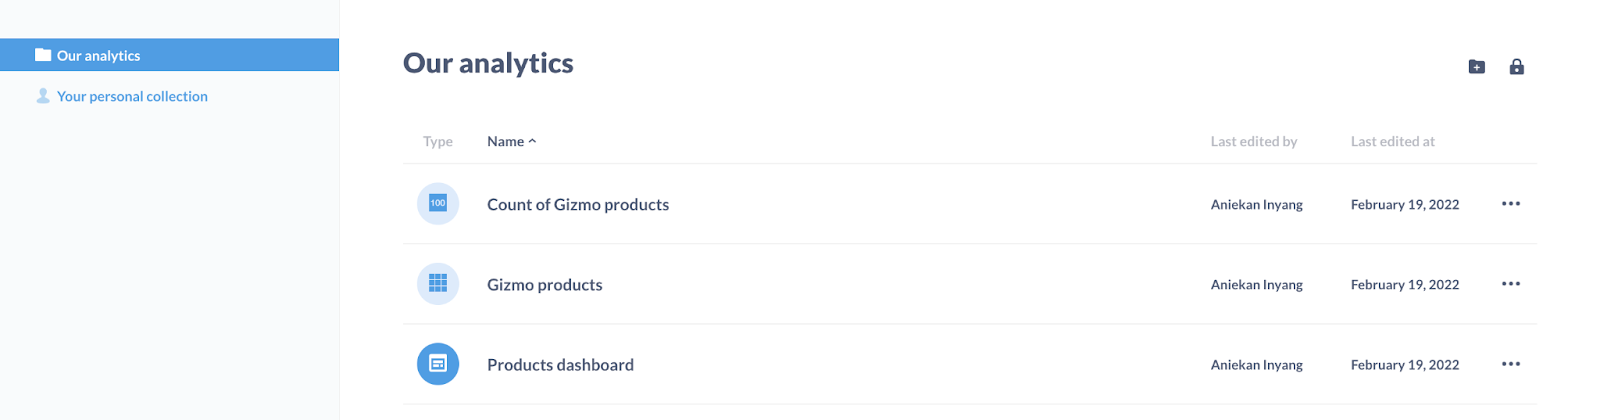
Viewing your collection shows every query and dashboard created in that collection, as well as version history for the items showing who created it and who modified it at every time.
Metabase Limitations
As mentioned earlier, you cannot combine data sources in a query on Metabase. This makes the work a bit manual if you need to join data from multiple data sources, as you would have to download the individual data results and perform the analysis somewhere else (maybe a Python notebook, Microsoft Excel, Google Sheets, etc.). You also cannot join tables from different databases.
One way to overcome this limitation is to connect multiple data sources via a connector and load the data from multiple sources into a data warehouse.
Conclusion
I hope this article has been helpful to get you started with using Metabase for your business intelligence needs. You can also reach out to me on Twitter, LinkedIn or send an email: contactaniekan at gmail dot com if you want to chat more about this or if you have any suggestions for more related posts on data tools.
Thank you for reading.
Aniekan.
Further reading
